
Start with the day the work becomes available
A brand forecasts 1,000 orders for next week. A warehouse says it can ship 250 a day over five days. The weekly numbers look comfortable: 1,250 potential shipments against 1,000 orders. Yet that comparison leaves out the question customers care about: when will their particular orders leave?
The useful selection conversation starts with a daily release file. Separate orders that exist in the storefront from orders actually ready for warehouse work. Inventory holds, payment review and scheduled launches can concentrate releases even when sales arrive steadily. Ask which timestamp starts the agreed shipping clock.
Compare two weeks with the same total
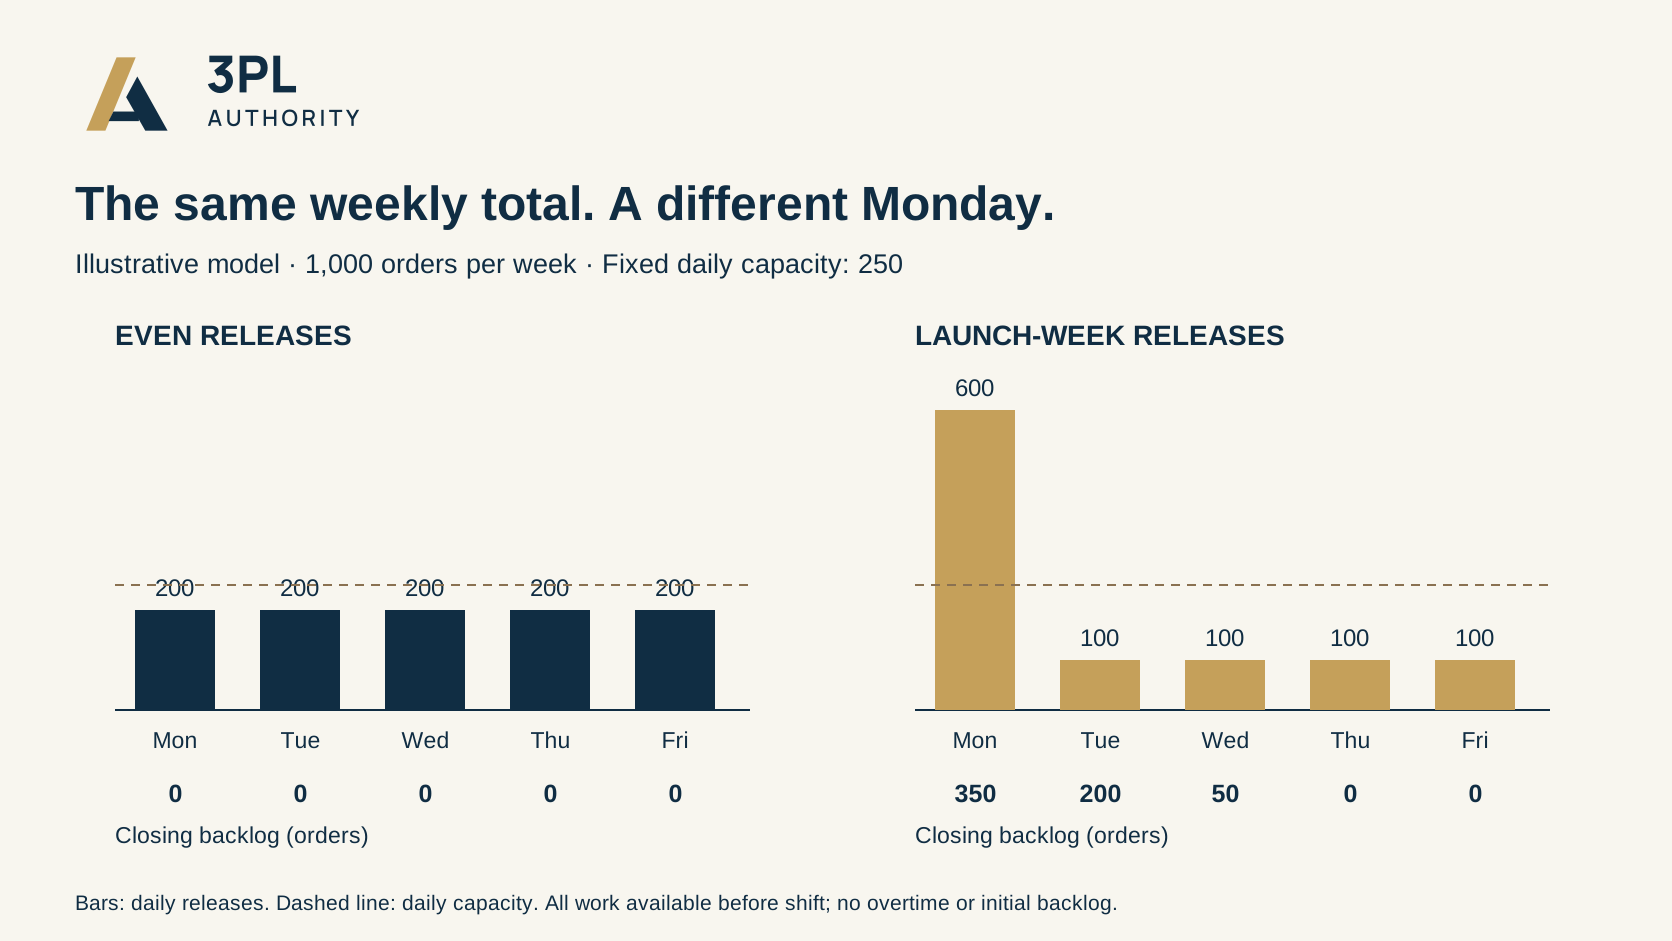
We calculated two fictional five-day schedules. Both contain 1,000 identical, fully available orders. All daily releases arrive before the workday starts; capacity is a fixed 250 orders per day; unused capacity cannot be carried forward. There is no starting backlog, overtime or weekend work. These are assumptions, not measured warehouse capabilities.
| Day | Even releases | Even closing backlog | Launch-week releases | Launch closing backlog |
|---|---|---|---|---|
| Monday | 200 | 0 | 600 | 350 |
| Tuesday | 200 | 0 | 100 | 200 |
| Wednesday | 200 | 0 | 100 | 50 |
| Thursday | 200 | 0 | 100 | 0 |
| Friday | 200 | 0 | 100 | 0 |
The calculation is closing backlog = maximum of zero and opening backlog plus released orders minus daily capacity. Both weeks clear by Friday. Only the even-release week clears each day's work that day. Under first-in, first-out processing, 100 of Monday's orders do not leave until Wednesday in the launch case.
A Friday clearance report therefore cannot establish that a Monday shipping promise was met. If the promise allowed a longer processing window, assess that actual window instead. The table is a stress test of timing, not evidence that one service level is appropriate for every brand.
Do not turn an average into a guarantee
The Lean Enterprise Institute's definition of takt time relates available production time to customer demand. That is useful context for discussing pace, but our calculation is a daily queue model, not a takt-time measurement or an estimate of labor productivity.
For a real shortlist, replace the fixed capacity with the provider's documented plan for your order mix. A day of single-item parcels is not interchangeable with a day of complex bundles. Keep receiving, replenishment and carrier collection constraints visible rather than assuming every available labor hour produces a departure.
Ask for a response to the release curve
Send candidates the same anonymized daily pattern and ask them to identify the first day a backlog would appear. Request the planned clearance date, the resource or operating change needed, the associated price and the person authorized to activate it. Ask what happens if the launch moves forward one day.
Then compare alternatives: changing the release plan, buying a specific capacity commitment, or changing the customer promise before orders are accepted. Do not count an unconfirmed overtime option as available capacity.
Keep one version of the forecast with its assumptions and update history. During onboarding, reconcile actual release timestamps and departures against that version. The decision is whether the provider can handle your pattern at the agreed service level—not whether a large weekly number sounds reassuring.
Related reading
Sources
- Source 1 — accessed 2026-11-02.