
A fulfillment proposal can reduce warehouse fees while requiring the brand to hold more stock. Another can cost more each month while supporting a smaller inventory position. Comparing those offers requires two separate views: money tied up in inventory and the recurring cost of carrying it.
The distinction matters because a one-time reduction in inventory is not an annual saving of the same amount. It may improve liquidity, but the business still needs to compare ongoing service fees, replenishment costs and the availability it promises customers. A provider should not win a shortlist because those different benefits have been added together incorrectly.
Start with stock coverage, then challenge the assumption
Shopify's inventory-report documentation describes days of inventory remaining as a quantity-to-sales-rate estimate. Its product report uses historical sales; it does not establish a safe stock target or guarantee future demand. A buyer can use that kind of coverage measure to frame a question, then test the replenishment assumptions behind it.
Ask candidates what would actually permit less stock. Possibilities to investigate include shorter receiving delays, more frequent supplier deliveries or better visibility of available units. These are hypotheses for the proposal, not automatic benefits of outsourcing. Supplier production constraints may prevent a reduction even if warehouse performance improves.
Keep the comparison boundary fixed. Count the same products, at the same cost basis, across the same locations. Moving units from a 3PL to the supplier's dispatch area does not necessarily reduce the brand's total inventory exposure. The commercial terms and ownership timing need separate confirmation.
One illustrative cash-and-cost comparison
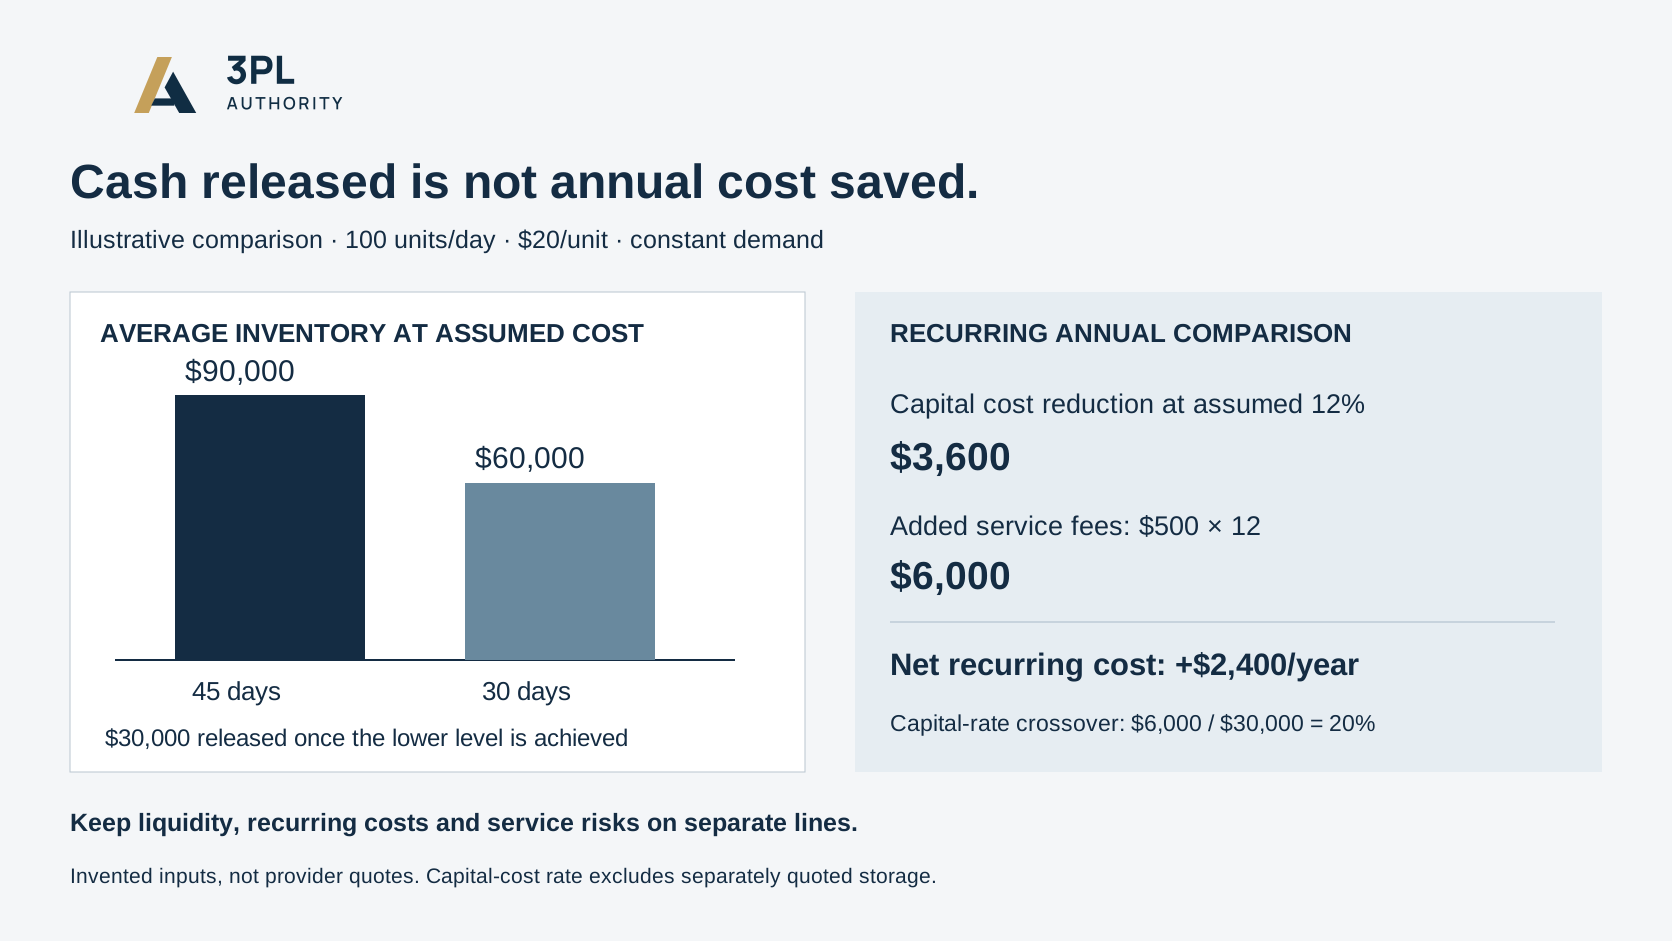
We calculated two hypothetical average inventory positions for a business selling 100 units a day, with a product cost of $20 a unit. Demand is assumed constant solely to isolate the financial distinction. These are invented inputs, not provider quotes or a stock recommendation.
| Measure | 45 days of average stock | 30 days of average stock |
|---|---|---|
| Units represented | 4,500 | 3,000 |
| Inventory at assumed cost | $90,000 | $60,000 |
| Annual carrying cost at an assumed 12% | $10,800 | $7,200 |
The modeled reduction releases $30,000 from inventory once the lower position is achieved. The annual carrying-cost difference is $3,600. If the second provider costs $500 more each month, its annual fee premium is $6,000. On these inputs, recurring cost increases by $2,400 despite the liquidity improvement.
For this exercise, the 12% rate is an invented annual capital-cost assumption, excluding storage already present in the fulfillment quote. It is not a market financing rate or a complete carrying-cost estimate. Using a broader carrying-cost rate without removing separately quoted storage would risk counting the same expense twice.
Find the condition that changes the decision
With a $30,000 inventory reduction and a $6,000 annual fee premium, the capital-cost rate would need to reach 20% for that benefit alone to match the premium. That crossover does not establish which offer is better. It identifies a sensitive assumption that the buyer can replace with its own evidence.
A brand may still prefer the more expensive offer because cash availability is a binding constraint. Conversely, a promised stock reduction may be worthless if it creates missed orders or requires costly emergency replenishment. Keep those effects visible as separate, initially unknown lines rather than assigning them convenient values.
Make the lower-stock proposal earn its place
Before committing, request a SKU-level replenishment plan, receiving assumptions, minimum purchase quantities and a proposed trial boundary. Decide what evidence would justify reducing inventory and how the brand would respond if demand or inbound timing changed. Do not lower buffers simply because a sales presentation shows a smaller number.
The useful shortlist question is not whether a provider claims to optimize inventory. It is whether the proposed operation can support a defined stock position, at an acceptable service level, and whether the resulting cash and recurring costs improve the business on its own terms.
Further reading
Use our 3PL selection guide to build the shortlist and fulfillment pricing guide to compare the scope of each offer.
Sources
Research accessed 2026-11-18.
- https://help.shopify.com/en/manual/reports-and-analytics/shopify-reports/report-types/default-reports/inventory-reports
Research method and limitations
Calculated two synthetic average inventory positions at fixed demand and unit cost; separated one-time cash release, annual capital cost and service-fee premium; derived a crossover. No actual inventory or provider sample. Original calculations and proposed controls are editorial desk analysis. No interviews, surveys, firsthand provider testing or provider responses occurred. Unknown capabilities and account-specific terms remain unknown.